
🟣 TXN Weekly Cycle Completed (+194%) — Step 2 Reached | Cyclica System Update
Activation, Steps and strategy is always shared for members

Ticker: TXN
Timeframe: Weekly
A full weekly cycle has reached completion.
From activation to final extension, this sequence developed into one of the strongest long-duration cycles tracked on TXN within the Cyclica framework.
📊 Cycle Data
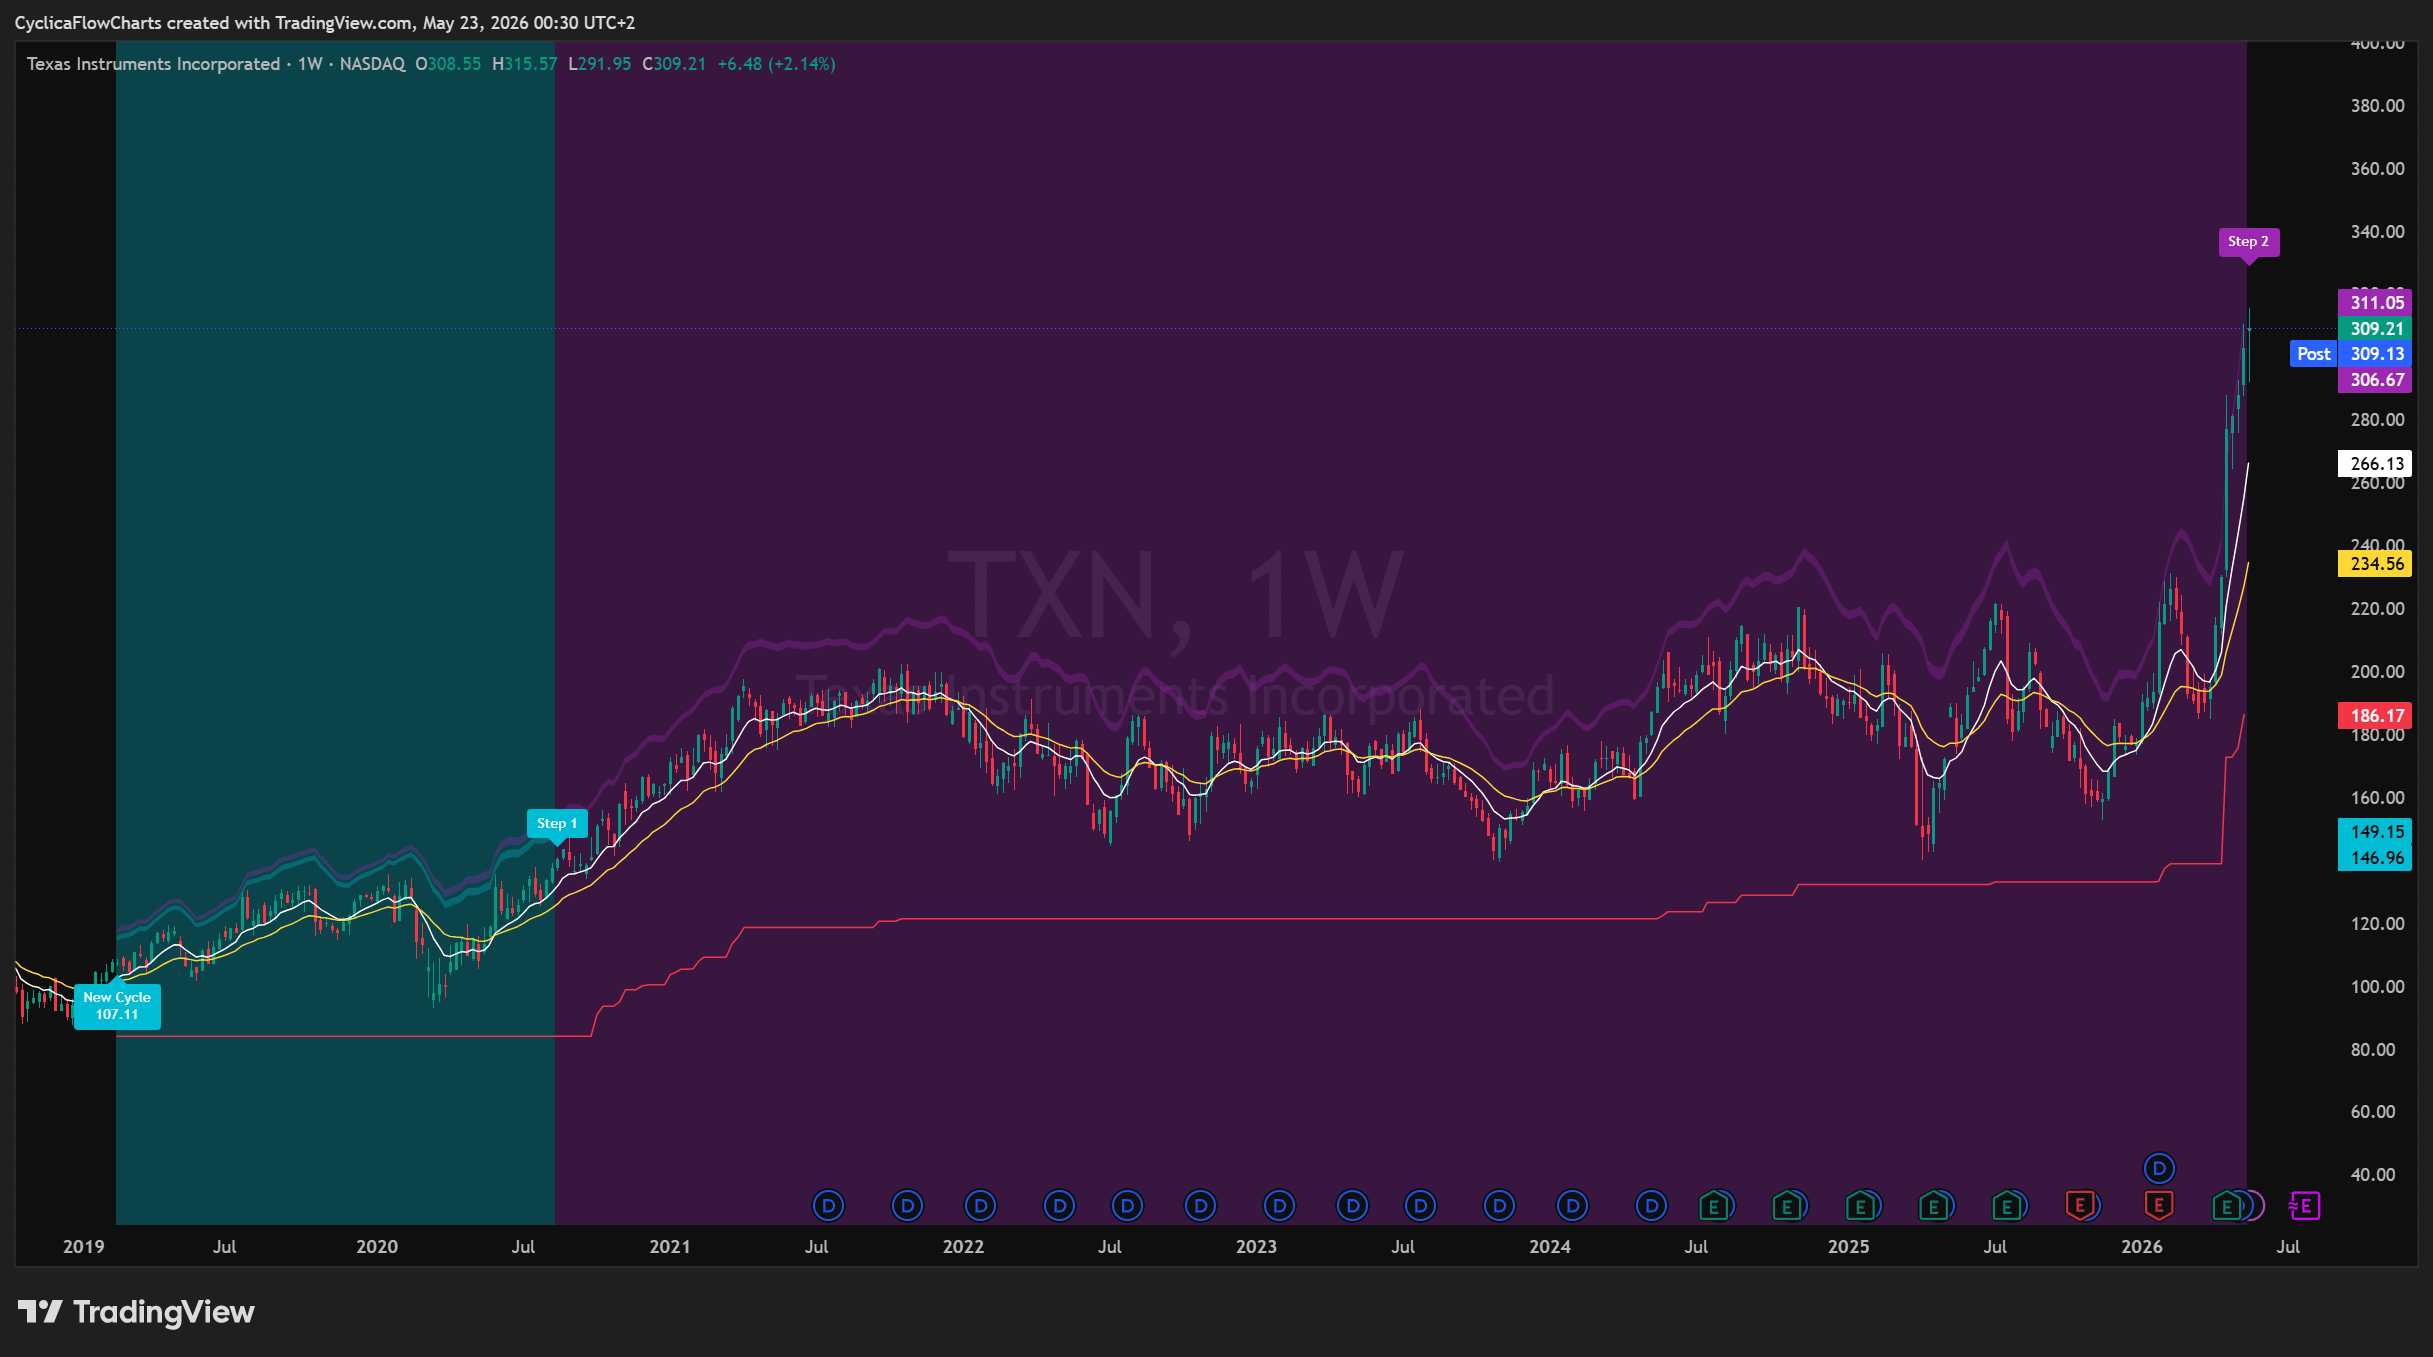
Activation Area: 107.11
Step 1 Reached At: 139.25
Step 2 Reached At: 315.00
Date: May 23, 2026
📈 Performance Breakdown
Activation → Step 1: +30.01%
Activation → Step 2: +194.09%
Step 1 → Step 2: +126.20%
📊 Weighted Cycle Contribution
Weighted Return Contribution: +161.27%
This cycle represents a sustained continuation phase after Step 1,
with structural alignment persisting over multiple years.
📉 Chart — Weekly Cycle Structure
🔄 Structure Summary
Activation confirmed structural alignment
Step 1 validated continuation
Extension persisted significantly beyond initial expansion
Step 2 reached, completing the cycle
Cycle completed without invalidation.
📚 TXN — Historical Cycle Overview
Previous completed cycles on TXN show how outcomes can vary significantly depending on market conditions and continuation strength:
2002 (failed cycle)
Outcome: −41.41%2003 → 2004
Step 1: +30.03% → Step 2: +6.98%2004 → 2008
Step 1: +30.04% → Step 2: −3.26%2009 → 2017
Step 1: +30.01% → Step 2: +348.56%2019 → 2026
Step 1: +30.01% → Step 2: +194.09%
The current cycle ranks among the strongest completed sequences observed on this ticker.
Historical examples are provided for context only and are not predictive.
📊 Cycle Progression — Closed Cycles
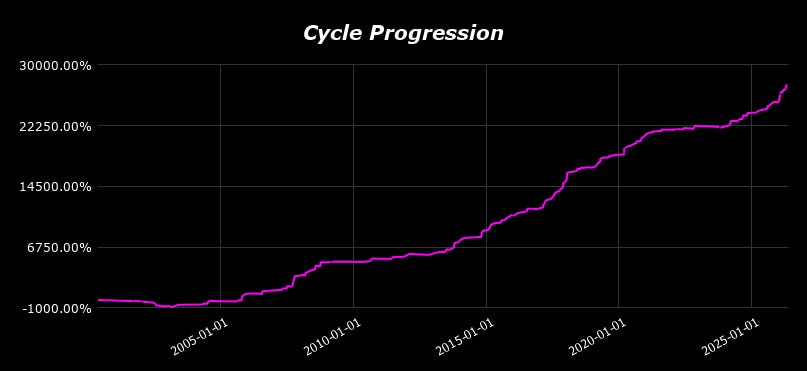
This chart aggregates the results of completed cycles within the Cyclica framework, ordered by their completion date.
Each data point represents one fully closed cycle
Values are based on weighted progression (Activation → Step 2 or termination outcome)
Results are cumulative and non-compounded
Active cycles are excluded
With a large sample of cycles, the objective is to observe how outcomes accumulate across independent sequences over time.
This is not a portfolio representation.
📊 Cyclica — System Statistics (Closed Cycles Only)
Based on 415 completed cycles
📈 Core Metrics
Tickers on the Basket: 88
Total Activations: 466
Closed Cycles: 415
Active Cycles: 49
Winning Cycles: 270
Losing Cycles: 145
Winning Rate: 65.06%
📊 Performance Overview
Cumulative Weighted Return: +27,636.47% (non-compounded)
Cycles Above +100%: 119
⏱ Activity Profile
Average Cycles per Year: 17.26
Maximum Losing Streak: 11
🧠 What Comes Next
One cycle has now completed.
Others remain active.
Some are still in early structural phases.
Others are approaching continuation conditions.
The largest extensions rarely appear obvious at the beginning.
🔒 Full Disclaimer
This content is provided for educational and informational purposes only.
Cyclica is a rules-based tracking framework, not an investment service, advisory business, or signal provider.
Nothing in this publication constitutes financial advice, investment advice, a recommendation, or an offer to buy or sell any financial instrument.
All data, metrics, and figures presented — including cycle progression, cumulative returns, and system statistics — are derived from historical observations of predefined structural conditions.
All results are presented on a cumulative and non-compounded basis and represent the aggregation of independent cycles rather than portfolio performance.
Past outcomes do not guarantee future results.
Educational only. Not financial advice.