
🔴 ISRG Weekly Cycle Completed — Another Long-Term Sequence Added to the Record | Cyclica System

Ticker: ISRG
Timeframe: Weekly
Another weekly cycle has reached completion.
The latest ISRG sequence has now been added to more than two decades of historical observations within the Cyclica framework.
While not every completed cycle becomes a multi-hundred-percent extension, documenting every outcome is what allows the dataset to remain consistent over time.
📊 Cycle Data
Activation Area: 262.19
Step 1 Reached At: 340.85
Close Price: 364.87
Completion Date: July 13, 2026
📈 Performance Breakdown
Activation → Step 1: +30.00%
Activation → Close: +39.22%
📊 Weighted Cycle Contribution
Weighted Return Contribution: +37.38%
The cycle reached Step 1, continued higher, and ultimately completed with a positive outcome.
📉 Chart — Weekly Cycle Structure
🔄 Structure Summary
Activation confirmed structural alignment
Step 1 validated continuation
The cycle remained constructive before reaching its completion
Cycle completed.
📚 ISRG — More Than Two Decades of Historical Cycles
ISRG has been one of the longest-tracked companies within the Cyclica dataset.
Previous completed cycles include:
2001 → 2003: −62.86%
2003 → 2005: +526.25%
2007 → 2008: +92.53%
2009 → 2013: +134.89%
2014 → 2018: +228.78%
2019 → 2020: −30.80%
2020 → 2022: +15.77%
2022 → 2026: +39.22%
The outcomes vary.
The methodology does not.
Historical examples are presented for context only and should not be interpreted as predictive of future performance.
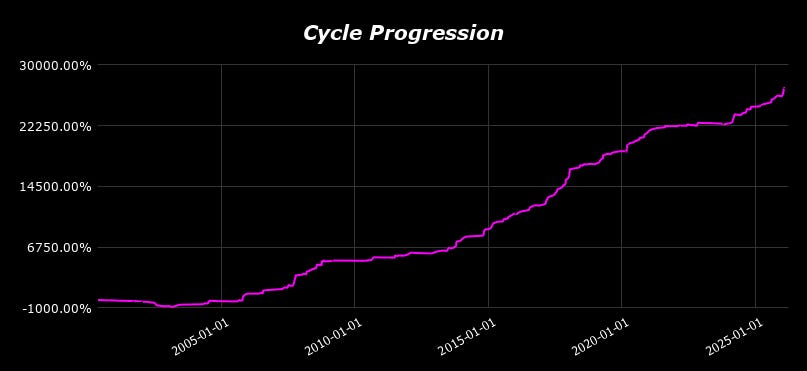
📊 Cycle Progression — Closed Cycles
(Insert performance chart here)
This chart aggregates the results of completed cycles within the Cyclica framework, ordered by their completion date.
Each data point represents one fully closed cycle.
Values are based on weighted progression (Activation → completion).
Results are cumulative and non-compounded.
Active cycles are excluded.
This is not a portfolio representation.
Its purpose is to document how independent cycles have evolved across different companies and market environments.
📊 Cyclica — System Statistics (Closed Cycles Only)
Based on 430 completed cycles
Core Metrics
Tickers on the Basket: 89
Total Activations: 485
Closed Cycles: 430
Active Cycles: 53
Winning Cycles: 282
Losing Cycles: 148
Winning Rate: 65.58%
Performance Overview
Cumulative Weighted Return: +28,716.71% (non-compounded)
Cycles Above +100%: 123
Activity Profile
Average Cycles per Year: 17.96
Maximum Losing Streak: 10
👀 Every Completed Cycle Starts the Same Way
ISRG is now another completed sequence.
The interesting part is never the finished chart.
It’s recognizing structure before the outcome is known.
While this cycle now belongs to history, dozens of others remain active and continue to develop.
Some will terminate.
Some will produce modest outcomes.
A few may eventually become the next multi-year extensions.
The challenge has always been identifying them before they become obvious.
🔒 Full Disclaimer
This content is provided for educational and informational purposes only.
Cyclica is a rules-based tracking framework and does not provide investment advice, recommendations, or trading signals.
All data, metrics and historical statistics are derived from predefined structural observations.
Performance figures are presented on a cumulative and non-compounded basis and represent independent historical cycles rather than portfolio performance.
Past performance does not guarantee future results.
Educational only. Not financial advice.